
How to Look Up Fresno County Jail Population Data
Fresno County does not host one single daily jail population dashboard on the Sheriff's site. Facility-level capacity numbers live on the Sheriff Jail Division page and the Public Health Correctional Health page. State-level monthly counts come from the California Board of State and Community Corrections Jail Profile Survey. National jail population reports come from the Bureau of Justice Statistics. BSCC data is updated monthly. BJS jail reports come out once a year.
The Sheriff page lists each open facility, the year built, and a legacy combined open-floor capacity figure. The Public Health page lists a maximum population for each facility. The BSCC Jail Profile Survey shows average daily population (ADP), bookings, releases, and held-on-felony shares by month for each California county. BJS reports break the national jail pool into pretrial and sentenced, by sex, by race, and by offense type. Read the Sheriff and Public Health numbers as official local capacity, and read BSCC and BJS numbers as the most current population shares for the state and nation.
Fresno County Jail Capacity Overview
The county runs three open jails: Main Jail, North Annex Jail, and West Annex Jail. The older South Annex Jail was permanently closed on December 14, 2024 and was replaced by the new West Annex. The Sheriff Jail Division page still carries a legacy line that gives a combined open-floor capacity of 2,427 inmates, dating from when South Annex was still in service. That figure is in transition. Public Health publishes a facility-specific maximum population for each adult jail. The most accurate way to describe Fresno County jail capacity today is to list each facility and note that the South Annex bed count is no longer in active use.
| Facility | Rated Capacity | Status |
|---|---|---|
| Main Jail (1225 M Street, opened 1989) | 1,064 maximum population | Open |
| North Annex Jail (1265 M Street, built 1993) | 432 maximum population | Open |
| West Annex Jail (2208 Merced Street, opened December 2024) | 300 beds | Open |
| South Annex Jail (2280 Fresno Street) | 675 legacy maximum population | Closed December 14, 2024 |
The Sheriff Jail Division page gives a useful first look at how the jail system is laid out and which buildings are still in use.
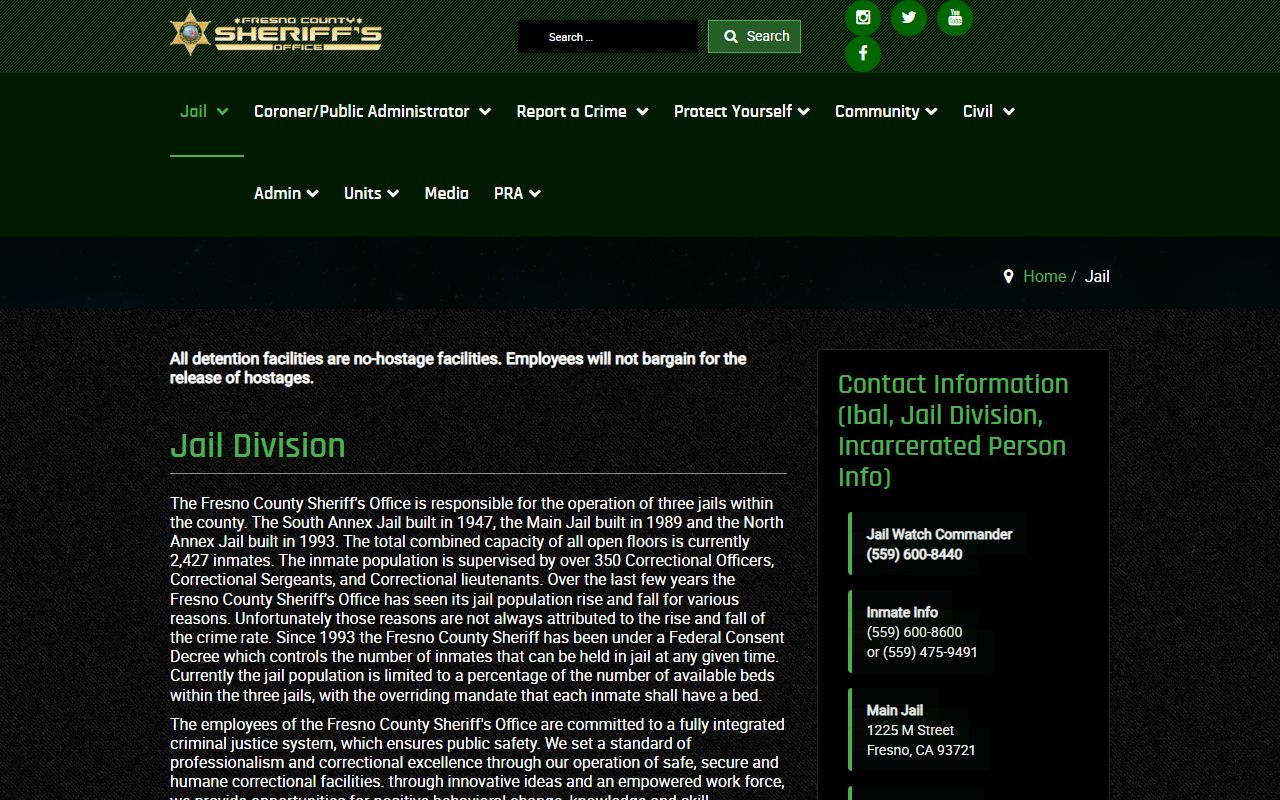
The page does not yet replace the older 2,427 combined figure, so readers should treat that number as legacy and use the per-facility maxima for current planning.
Average Daily Population
An exact, current, 5-year Fresno County average daily population chart was not located in the Sheriff or Public Health pages. ADP is not the same as rated capacity. ADP is the mean number of people in custody on each day of the month or year. The most reliable place to find Fresno County ADP is the BSCC Jail Profile Survey, which lists ADP by month for every county jail system in California. The federal consent decree in place since 1993 sets a hard cap on how many people can be held, so Fresno County ADP tends to stay below total rated capacity even during peak booking months.
For build-time accuracy, do not use third-party jail summaries as the ADP source. Use BSCC monthly survey data, the county budget book, and the Sheriff's annual report. These three sets agree on bookings, releases, and held-on-felony shares far better than aggregator sites.
The jail staff count is one part of the population picture that the Sheriff does publish. The Jail Division page states that the jail is run by more than 350 correctional officers, correctional sergeants, and correctional lieutenants. That staff-to-inmate ratio is one of the key inputs the federal court watches under the consent decree.
Demographic Breakdown
Fresno-specific gender, race, and age splits are not published on the Sheriff or Public Health pages reviewed for this build. For statewide and national context, BSCC reports sex and held-on-felony shares by county each month, and BJS reports race and ethnicity shares for the national jail pool. The table below shows the kinds of fields a full Fresno jail demographic chart would include once county-level data is sourced from BSCC.
| Group | Data Source for Fresno-Level Share |
|---|---|
| Male | BSCC Jail Profile Survey, county row |
| Female | BSCC Jail Profile Survey, county row |
| Adults (18+) | Sheriff annual report |
| Race and ethnicity shares | BSCC plus BJS national context |
Use the BSCC row for the most recent month rather than an outside summary. Race and ethnicity in jail data should always cite the original BSCC or BJS table.
Pretrial vs Sentenced Population
The pretrial share is the part of the jail population still waiting for trial or final case action. The sentenced share is the part serving a sentence after conviction. Fresno County exact monthly splits live in BSCC data. National BJS jail reports show that across the United States, most people in local jails are pretrial, not sentenced. That pattern holds for most California county jails as well.
| Status | Where to Find Share |
|---|---|
| Pretrial | BSCC Jail Profile Survey, Fresno row |
| Sentenced | BSCC Jail Profile Survey, Fresno row |
This split matters because pretrial release rules, bail reform, and court delays can each move the pretrial share up or down without any change in crime rate.
Misdemeanor vs Felony Population
Fresno County jail holds both misdemeanor and felony detainees, plus people held under state realignment AB 109 sentences. BSCC reports a held-on-felony figure for each county. That figure is the share of the jail population held on at least one felony charge. The county does not publish a misdemeanor-only count on the Sheriff page reviewed for this build. To get a felony share for Fresno, pull the most recent BSCC monthly row and divide held-on-felony by total population. National BJS data confirms that felony detainees take up the largest share of bed space across most local jails. AB 109 realignment, in place across California since 2011, also shifts certain low-level felony sentences to county jail time rather than state prison, which can raise the local felony-sentenced share over time.
Mental Health and Medical Population
Fresno County Public Health runs correctional health for the jail. The Correctional Health page reports more than 100,000 sick calls and 40,000 screenings each year across the adult jail facilities. That is one of the highest local jail medical service loads in the Central Valley. Services include health screening at booking, nursing sick call, clinician sick call, medication management, dental care, lab services, and a 35-bed outpatient holding unit at Main Jail.
The Public Health Correctional Health page gives the clearest view of how medical and mental health care fits into the jail population picture.
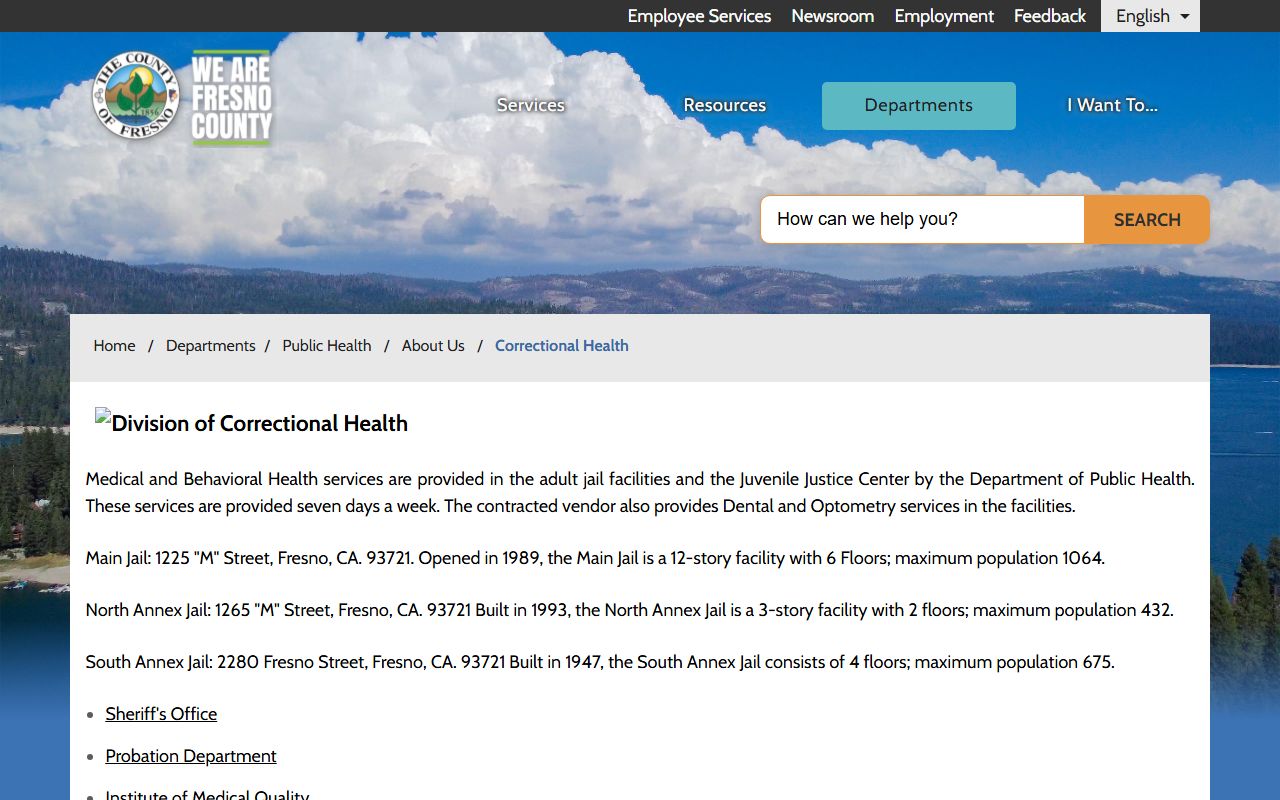
The same page lists each facility's address, year built, and maximum population, which is why this source is also used for the capacity table above.
National and State Context
National jail rates are tracked by BJS. The BJS National Jail Census and Annual Survey of Jails are the two main data sources. California-wide rates are tracked by BSCC, which collects monthly data from every county jail in the state. The table below shows what each row in a county-vs-state-vs-national rate comparison should be sourced from. Exact per 100,000 rates change each year and should be pulled from the most recent BSCC and BJS releases at build time.
| Level | Data Source for Rate per 100k |
|---|---|
| Fresno County | BSCC Jail Profile Survey, county row, divided by latest county population estimate |
| California | BSCC statewide totals |
| National | BJS Annual Survey of Jails |
Fresno County rates should be read alongside the consent-decree cap. A county cannot run far above its bed limit even when arrests rise, so the local rate may look flatter than the state or national rate over short stretches.
Population Trends Over Time
From 2020 through 2026, the Fresno County jail population story is less about a clean year-over-year line and more about building swaps, consent-decree compliance, and changes in pretrial rules. The Sheriff's public jail page states plainly that jail population rises and falls for reasons not always tied to crime rates. The biggest facility-level change in the period is the move from the old South Annex to the new West Annex.
The Sheriff news release on the West Annex opening gives the cost, the bed count, and the closure date for South Annex.
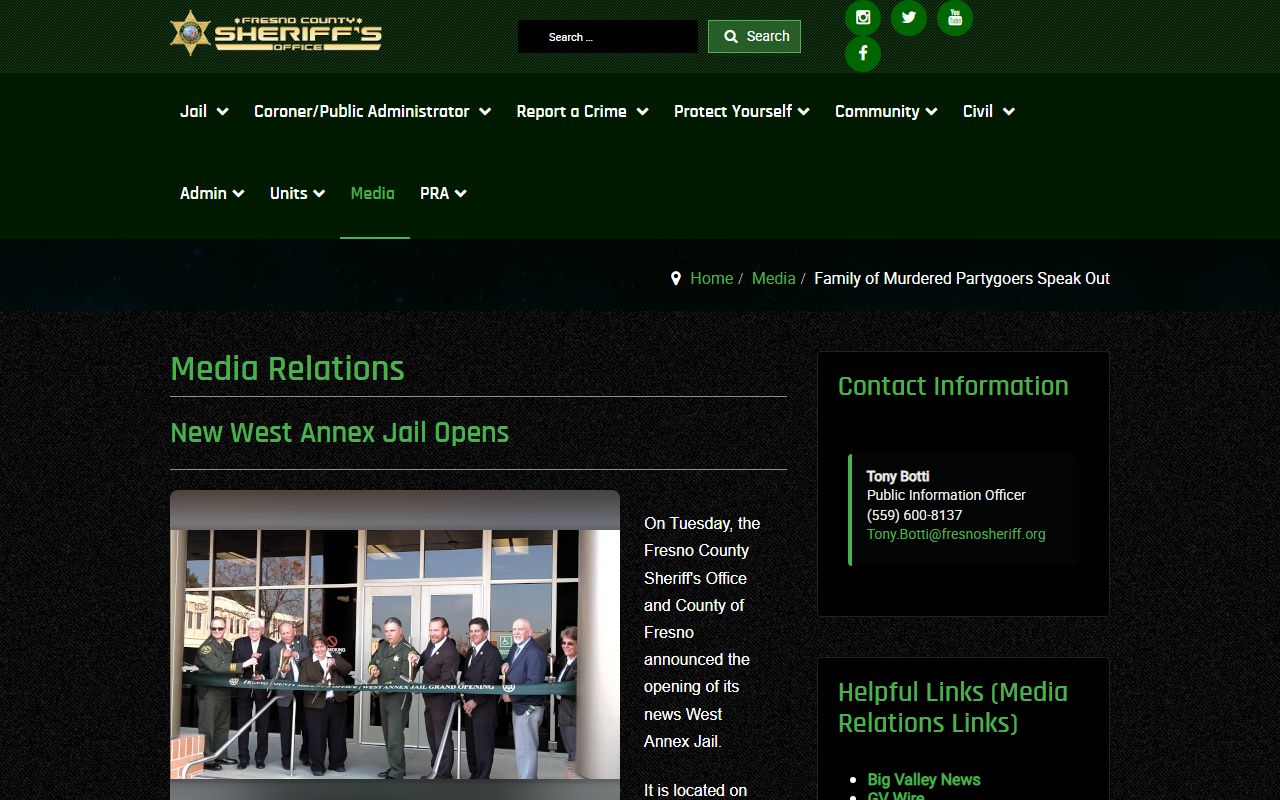
The West Annex cost about $100 million, with an $80 million state grant, and added 300 modern beds with classrooms, exercise yards, medical clinics, video visitation stations, and observation cells. The transition shifted housing patterns and bed types across the system, which makes flat year-over-year ADP charts a little misleading without a footnote about the facility swap.
Searching for Fresno County Inmate Records by Name
This page tracks aggregate jail population data, not individual lookups. For name-based searches of the current Fresno County Jail roster, use the Fresno County inmate records page, which links to the Sheriff Inmate Information Center and lists the right phone numbers. For people who are no longer in custody, see released inmates.
Where the Data Comes From
The numbers on this page draw from four official sources. The Fresno County Sheriff Jail Division page gives facility counts, staff counts, the consent-decree note, and the legacy combined open-floor capacity. The Fresno County Public Health Correctional Health page gives per-facility maximum populations, year built, and sick-call and screening volume. The California Board of State and Community Corrections gives the monthly Jail Profile Survey for every California county. The Bureau of Justice Statistics gives national jail population counts, pretrial and sentenced shares, and demographic shares.
Sheriff Jail Division: https://www.fresnosheriff.org/jail.html. Public Health Correctional Health: https://www.fresnocountyca.gov/Departments/Public-Health/About-Us/Correctional-Health. BSCC: https://bscc.ca.gov/. BJS: https://www.bjs.ojp.gov/.